
How to Calculate Productivity: Formula, Steps, and Examples
Productivity is computed by dividing the output by input. That is:
Productivity = Output ÷ Input
Output refers to the amount that is produced (number of units or tasks or money), while input is the resource needed for producing the output, such as labor hours, number of workers, or cost.
In this article, we will be examining the formula for calculating productivity, explaining the formula step by step, and providing an example. We will also be discussing how to compute productivity using our Productivity Calculator.
Want to skip the manual math? Use the Productivity Calculator here to get your result instantly.
What Is Productivity?
Productivity refers to the degree of effectiveness with which any particular input is transformed into output. It involves calculating what was achieved versus what was expended to achieve it, be it time, labor, capital or other inputs altogether.
Productivity is used by organizations to monitor the efficiency trend, compare various groups or shifts, and determine how output may be increased without additional inputs. In economics, the similar approach is applied for measuring productivity of the industry in terms of workers per output or hours per output at the national level. Productivity ratios can even be used on an individual basis to monitor personal output per hours worked. the U.S. Bureau of Labor Statistics publishes ongoing labor productivity data using this same output-per-hour approach
All in all, the basic principle of measuring productivity is quite universal and does not change depending on the situation. The figure itself cannot mean anything until it is compared to something, be it previous period, some standard or output of another group measured in the similar manner.
Productivity Formula
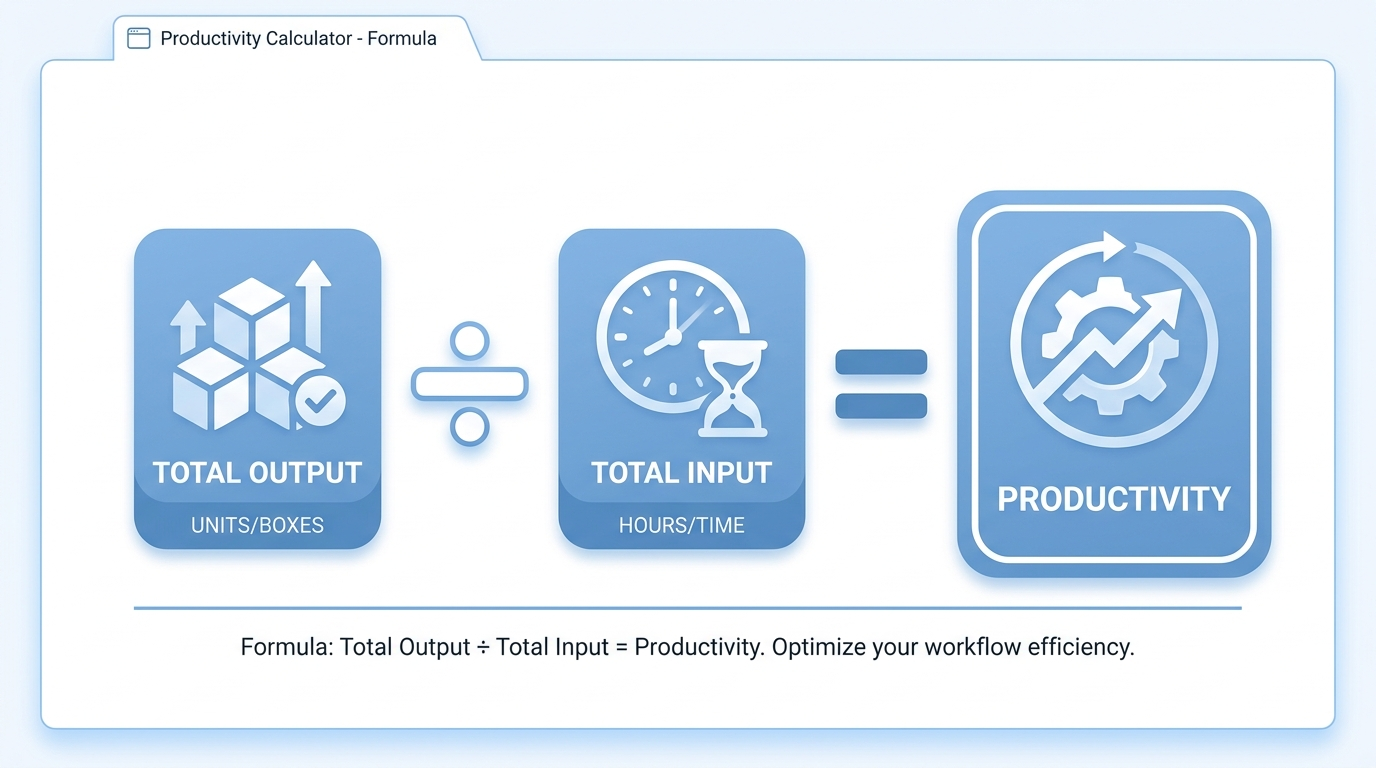
The basic productivity formula in terms of output to input ratio is as follows:
Productivity = Total Output ÷ Total Input
Where:
Total Output = amount of production – units produced, orders fulfilled, services rendered, and sales.
Total Input = the amount of input consumed in producing the above output – labor hours, number of people, and costs.
It is up to the units of both total output and total input that determine the unit of measurement for the resulting output-to-input productivity ratio. If units are measured in units, while labor hours are used to measure input, then the unit of the ratio would be units/labor hour. Output and input have to be measured for the same period of time otherwise there would be a distortion in the calculation process.
However, if one wants to calculate productivity in terms of percentages instead of ratios, it is necessary to compare the current output-to-input ratio to the base or standard one:
Productivity Percentage = (Output-to-Input Ratio ÷ Standard Output-to-Input Ratio) x 100
How to Calculate Productivity
- Define the time span. Determine if you’re looking at productivity of one day, one week, one month, or some other time span.
- Calculate the total output. Calculate the total number of products, jobs done, money earned, etc. that were produced over that time span.
- Calculate the total input. Measure the total number of man-hours spent, the number of workers, or the expense incurred to produce that output over the same period.
- Output/ Input. Use this equation to calculate productivity: Productivity = Total Output ÷ Total Input.
- Percentage if required. In case you want to compare this productivity with any benchmark or previously known result, then calculate the percentage using this equation:
- Productivity % = (Current Productivity ÷ Benchmark Productivity) × 100
- Compare. Compare this number with the previous time span or any other group’s productivity.
Productivity Calculation Example
A small team involved in manufacturing wishes to calculate the labor productivity for one shift.
- Total production = 960 units of production
- Total labor usage = 40 labor hours
- Productivity = 960/40 Productivity = 24 units/labor hour
The team managed to produce an average of 24 units for each labor hour of work done.
Now, assume that the standard productivity ratio of this process is 20 units/labor hour.
Productivity Ratio % = (24/20) × 100 Productivity Ratio % = 120%
The team has performed 120% of the standard ratio, which means their output exceeded expectations by 20%.
How to Use the Productivity Calculator
The Productivity Calculator applies this same formula automatically once you enter your figures.
- This formula is automatically employed by the Productivity Calculator after the user inputs his/her data into the calculator.
- Input Total Output. This is the amount of output produced in units, number of tasks completed, or total income.
- Input Total Input. This is the number of working hours, total manpower, or total cost used to generate that output.
- Input time period (optional). Ensure that the output and input relate to the same period of time in order to get an accurate result.
- Input a standard or baseline productivity figure (optional). If you require your productivity to be expressed in terms of percentage, input the baseline productivity figure.
- Observe the result. You will be provided with your productivity ratio, and also if you have input a standard or baseline productivity figure, you will be provided with your productivity percentage.
If your work involves labor hours specifically across a team or shift, the labor productivity calculator is built around that exact use case. Healthcare and clinical teams tracking billable or session-based output may find the therapy productivity calculator more directly suited to their metrics.
How to Interpret the Results
Increased productivity rate means increased amount of output produced per unit of input, while reduced productivity rate implies reduced amount of output produced per unit of input. However, whether or not the figures are good or bad would depend on what those numbers are being compared with.
An increasing pattern over multiple time frames means either improvements in processes, equipment or staff. On the other hand, if there is a decreasing pattern, then this could mean either bottlenecks, staffing problems, equipment problems or low demand. Since different industries have different acceptable productivity rates and even different job positions have different acceptable productivity rates, comparison should be made with past performance of that same group or with an internally set standard, not with an external standard.
Common Uses
- Manufacturing: Tracking units made per hour worked by each laborer in the assembly line.
- Retail and service industry: Monitoring sales or number of transactions made per hour of work done by each staff member.
- Health care and clinics: Measuring the amount of billing or patient visit per hour of clinician’s work.
- Remote and intellectual work: Recording number of tasks accomplished per hour of work done.
Common Mistakes to Avoid
- Mis-matched time periods: The use of a monthly figure for output and a weekly figure for input leads to an incorrect productivity rate. Ensure that the output and input periods match each other.
- Combination of different inputs: Including both labor hours and cost figures in the same calculation makes the result inaccurate. Only choose one input factor for one calculation.
- Mis-interpreting the raw rate as a percentage: “Productivity rates such as ’24 units per hour’ are not percentage rates in themselves because a percentage rate needs a base to compare against.”
- Quality issue: Counting units that have been reworked or found to be defective as productive output leads to increased productivity results.
- Comparison of different groups of workers: Productivity of different groups working in different jobs is not comparable.
Limitations
The output/input ratio calculates quantity with reference to resources used, but not the quality, customer satisfaction, or difficulty of the task accomplished. Two groups may have similar productivity ratios, but deliver quite distinct quality of output. Additionally, the output/input ratio does not take into account external elements beyond the control of workers, such as machine breakdowns, supply shortages, or changes in seasonal demand. In making organizational decisions that affect pay, hiring, or performance assessment, use productivity numbers alongside other data.